MSCI Emerging Markets Index correlation with CNX Nifty

MSCI Emerging Markets Index

Its a stock market index which takes into account 817 stocks across 21 emerging market economies. It covers approximately 85% of all the emerging market economies based on the free-float method.

So, yeah. Its one of the broadest indices out there on the emerging markets.

It comes in many flavors as far as the currency denomination is concerned. Two of the popular ones are the dollar denominated MSCI EM index and local currency denominated MSCI Emerging markets index. Here local currency refers to the individual currencies of the constituent countries.

For my article, I’ll be taking the local currency denominated MSCI EM index.

CNX Nifty

Its the benchmark large cap index of the Indian stock market. It takes into account the largest 50 stocks and covers almost 70% of the free-float market cap of all the stocks listed on the exchange.

Its also important for an investor/trader as most mutual funds measure performance (alpha) with respect to it. There are also a lot of derivative contracts worth hundreds of millions of dollars linked to it. So, the index assumes a larger importance even though its not a broad based one.

The Correlation

The Indian component of the MSCI Emerging markets index is pretty small actually – at around 6.4% (August 2012) but still it seems to have a high correlation with the EM index.

To measure the historical correlation –  I have taken the 300 day exponential moving average of the 20 period historical correlation of the MSCI Emerging Markets index with respect to the CNX Nifty. A correlation of over 0.7 is considered pretty good.

It turns out the historical correlation comes to around 0.71 which indicates a high degree of correlation.

Historical Correlation MSCI Emerging Markets


Technically as well, we can see a lot of patterns on both the charts to be pretty similar.

The image below is that of MSCI Emerging Markets Index (local currency)

MSCI EM Local NSE Nifty


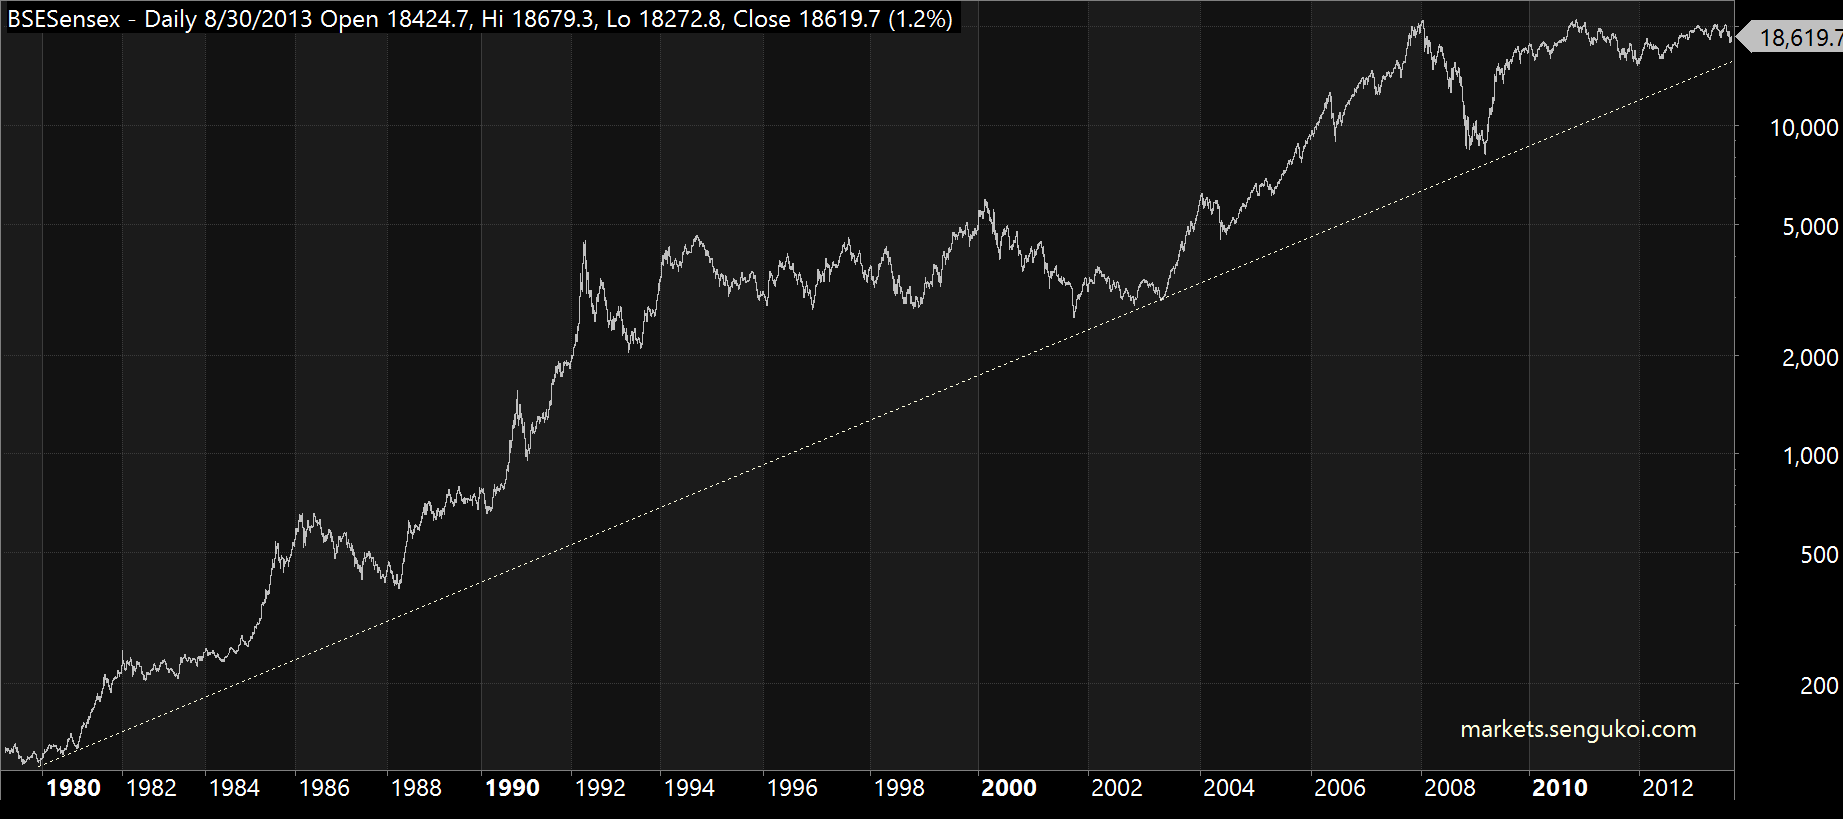
The image above is that of CNX Nifty

Usefulness

Knowing the high correlation between these two indices can be pretty useful.

Important and sustainable trends usually seem to occur together on both the indices.

So, for example the break of an important support (such as the 5400-5500 support of the Nifty in August 2013) was not confirmed by a similar break in the MSCI EM index and as one can see, the market just retraced the move completely and now both the indices appear to be in synch again.

Conclusion

As the markets open up more and more to the outside world, they also seem to act in a more correlated fashion. What effects one part of the world no longer is confined to that region alone.

For now, most emerging markets appear to be in a synch with a few differences. There doesn’t seem to be as much correlation with the developed economies but as time passes, that gap might close up as well.


If you liked the article, please share it. If you have anything to say or ask, feel free to leave a comment in the comments section below.

Like our facebook page @ http://www.facebook.com/markets.sengukoi 

How are Options priced?

Introduction to Options

Options are derivative contracts which give the holder the right (but not the obligation) to buy (call option) or sell (put option) a security at a particular price before or at the expiration of the contract.

For example, a CNX Nifty put option (Benchmark Indian Stock Market Index) may look like

October 2013 PE 5800 having a lot size of 50, quotes at 146 on October 1st 2013.

Nifty Options Contract


Nifty Options Chain

This means that the contract expires by the last Thursday of October 2013 (31st). PE stands for Put European. European options can be exercised on expiry day only while American options can be exercised on any day.

Put options give the right to sell the underlying security (Nifty in this case) at 5800 which is called the strike price. It is the price at which you can sell the security.

So in our example, if Nifty is at 5400 on October 31st 2013, then the option holder can exercise the option which gives him the right to sell Nifty at 5800. But since its trading at 5400 on October 31st, he immediately pockets the difference of 400 points. (5800 which is the strike price – 5400 which is the current price on 31st Oct).

His profit would be equal to 254 (400 – 154) because he paid 146 to purchase this contract on October 1st.

Since the lot size is 50, both the profit and loss along with the cost need to be multiplied by 50 to arrive at the actual figures in Rupee terms. In this case our cost of buying the option would be Rs 7,300 (146*50) and our subsequent profit would be Rs 12,700 (254*50)

European options can be exercised only on expiry (31st October in this case) but can be sold anytime.

Options pricing explained

Options have two broad components in their price. More »

Sensex chart since 1979

Below are some interesting charts of the Sensex (Indian Stock Market Index) from 1979 to 2013 (August).

Note – All charts are on a semi-log scale

Sensex Since 1979


Sensex Chart Trendline


Sensex Chart Since 1979


Some interesting observations

1) All major bull markets are followed by either bear markets or sideways markets.

2) If a prior bull market lasts a year, then the subsequent bear or sideways market lasts a couple of years or so.

3) If the prior bull market is prolonged and lasts 4-5 years with the index multiplying multi fold (a Super cycle Bull Market), then it is always followed immediately by a severe bear market crash (a Super cycle Bear Market). The bear market crash is followed by a multi year sideways market (Super cycle sideways market).

4) Fundamentally, one can correlate this chart with another chart I posted. Bull markets historically are almost always born out of extreme pessimism, undervaluation (P/E of 10-12) and a general lack of interest in stocks by the public and the investment community in general.

5) Bull markets end in euphoric optimism, extreme overvaluation (P/E of 26 or more) and a lot of interest More »

674760749_ba8c8a59ddMacroeconomic data such as the IIP (Index of Industrial production), CPI (Consumer price index) and GDP (Gross domestic product) have now been decided to be released after market hours (5:30 PM) instead of during market hours at 11 AM (as was done previously) by the government. The explanation put forth by the Indian government is that doing so would prevent a knee-jerk reaction by the market.

Silly explanation?

I personally feel this explanation to be silly. The markets are any way going to react to those numbers. If not the same day, then they will react the next day.

They might gap up (open higher than the previous day close) or gap down (open lower than the previous day close). Just by releasing the number post market hours doesn’t warrant a non reaction or a more logical reaction from the markets.

On top of that

Apart from that one must also remember the nature of a knee-jerk reaction. As its name implies, it is a short term reaction which occurs spontaneously to a particular news event. The key words are short term and spontaneous.

Short term reactions don’t last very long. A knee jerk reaction from the market usually lasts a few minutes and at the most an hour. Smart money usually kicks in by that time and takes opposite positions to the knee jerk move.

So, I’m not sure why the government is so worried about a knee jerk reaction which is short lived anyway.

The government should rather focus its attention on more productive things like keeping the fiscal deficit in check and passing reforms which would actually boost the economy.

Once it does the basics right, it doesn’t need to worry about silly things like releasing the macroeconomic data at 5:30 PM or maybe 2 AM when everyone is asleep and hoping the market wouldn’t react the next day.

Reference – http://mospi.nic.in/

Image credit – Discos Konfort

Nifty PE ratio, P/B, Dividend yield charts

Nifty PE ratio chart Sengukoi.com

Downloads

1) Nifty PE, P/B, dividend yield (excel workbook)

2) 14 Years Nifty PE, P/B, dividend yield (plain chart)

3) 14 Years Nifty PE, P/B, dividend yield (analysis chart)

NSE Website

View latest Nifty PE, P/B, dividend yield on the NSE website

Introduction

Nifty is a widely followed Indian stock market index comprising of the 50 largest publicly traded companies in India.

What is PE ratio?

PE ratio refers to price to earnings ratio. It is a widely used and simple ratio used to determine how cheap or expensive a stock/index is either historically or in the future (forward earnings), compared to its peers. More »

2994421437_e9f337b4d5Life is like an out-of-the-money options contract.

The premium is high at the beginning of the contract (at birth) and inevitably reaches zero as we age and die.

The volatility (ups and downs in our life) will change the premium temporarily, but time decay (ageing) slowly but maturely overpowers it.

For some, at critical events in their life, the premium may rise, even more that what it was at birth.

Some people, then bet that the premium will continue to rise while others who are more pessimistic will look to short us.

At any point of time, there will always be individuals looking to short us while friends, family and even strangers continue to believe in us.

While the price of our options premium varies greatly as we live, we must pay more attention to the underlying because that is the one that actually is unaffected by time decay and truly represents the intrinsic value of our life’s option.

Image credit – Jo@net

BoursaMost liquid index and stock options on the NSE

I had done a little research of my own yesterday (17th April 2013) and reviewed the 140 odd stock options available on NSE (National Stock Exchange, India). I spend around 30 seconds looking at each one of them on the NSE website and tried to categorize them into Tiers based on how liquid they are. As the Tier number increases, the liquidity (number of contracts traded each day) goes down. For example, Tier 1 stock options are more liquid than Tier 3 stock options and so forth.

Most liquid index options on NSE

Nifty, Bank Nifty

Most liquid stock options on NSE

Tier 1 (>2000 Contracts/day – 5)
Infosys, SBI, ICICI Bank, Reliance Industries, DLF Ltd More »

4111211837_a3a6f7e255Are EMA Crossover signals profitable?

This post is going to be slightly different from my previous posts. Instead of continuing with the articles on mutual funds, I’ll be talking about an experiment in technical analysis (a form of market analysis) I had done today. It basically involves seeing if EMA crossover signals (a technical analysis indicator) are of any use at all?

Are EMA crossover signals profitable?

Introducting the Experiment

The following experiment involves backtesting and analysing the EMA crossovers seen on the S&P CNX Nifty (the Indian stock market index) over the past three years.

By doing this backtesting, I tried to answer a curious question I had a few days back – What would happen if an individual trades only on the basis of EMA crossover signals generated? Would that be profitable? More »

8463683689_baa33ca431What is the Money Market? An Introduction – Part 2 of 2

Certificate of deposit

Most of the confusion surrounding certificate of deposit comes from the fact that its called by various names in other countries. For example, in

  • India it goes by the name of – Fixed deposit
  • UK – Bond
  • Australia, New Zealand – Term deposit
  • USA – Certificate of deposit/ Time deposit.

Certificate of deposit is basically a “certificate” issued by banks. The certificate among other things mentions the interest which the bank pays on the deposit and the time period after which the deposit can be withdrawn (premature withdrawal usually warrants a penalty).

A typical transaction involves an individual going to the bank to deposit his money for a fixed period of time (say 3 years) at a fixed interest rate (say 1.450% APY – Annual Percentage Yield) and the bank in return gives him a certificate of deposit with all the details. More »

8474532085_6d010ee8d0What is the Money Market? An Introduction – Part 1 of 2

The money market is basically one of the component of the financial markets. The key feature of the money market is that at its fundamental level it involves trading of financial instruments which are

1) Debt based
2) Short term in nature (maturing in a year or less) and
3) Traded OTC (Over the counter) i.e. not on an exchange.

A typical money market transaction involves an entity (either a large corporation, a bank or the government) borrowing money and in exchange giving an IOU to the lender. The IOU among other things specifies when the amount which was borrowed needs to be repaid (usually ranging from overnight repayment to a year) and at what interest. More »