
Nifty PE ratio, P/B, Dividend yield charts
Downloads
1) Nifty PE, P/B, dividend yield (excel workbook)
2) 14 Years Nifty PE, P/B, dividend yield (plain chart)
3) 14 Years Nifty PE, P/B, dividend yield (analysis chart)
NSE Website
View latest Nifty PE, P/B, dividend yield on the NSE website
Introduction
Nifty is a widely followed Indian stock market index comprising of the 50 largest publicly traded companies in India.
What is PE ratio?
PE ratio refers to price to earnings ratio. It is a widely used and simple ratio used to determine how cheap or expensive a stock/index is either historically or in the future (forward earnings), compared to its peers.
Think of it like putting your money in a fixed deposit. If you earn Rs 8 for every Rs 100 deposited, then the PE ratio of that investment would be Price (i.e. Rs 100 in this case) / Earnings (Rs 8) = 100/8 = 12.5
Please note = Historically, a higher PE ratio (usually over 26) signifies overvaluation and a lower PE ratio (under 13 sign ifies undervaluation)
What is P/B ratio?
P/B ratio here refers to Price to Book ratio. The stock price of a company (and its equity) always has two values.
One is the one assigned by the accountant called the book value and the other is assigned by the market which is the stock price one sees changing every day.
Usually, the price assigned by the accountant is lower than the stock price as determined by the market. That is because the accountant doesn’t take a lot of intangible assets into account. These may include patents, brand value, intellectual property, etc.
For example, imagine you wanted to sell bottled Mango juice. If you priced the juice similar to say, Mazaa or Frooti (popular Mango juice brands in India), would customers prefer to buy your juice or the branded ones? Most people would prefer a branded one and this “trust” obviously has some value, especially when dealing with competition.
Historically, the P/B value of Nifty has been between 2 to 5 (It reached as much as 6 in January 2008). This means that on average, the top 50 companies in the country are valued as much as twice to five times than what is actually “written in the book”.
P/B of around 2.75 to 3.25 is usually considered fair valuation for the index. Historically, P/B of around 2 or lower signifies the Nifty is undervalued and P/B of greater than 4.5 signifies rich valuations.
Please note = Historically, a higher P/B ratio (over 3.5) signifies overvaluation and a lower P/B ratio (usually below 2.5) signifies undervaluation
What is dividend yield?
A company distributes its profits in several ways. One of which is by giving dividends. The profits which the company generates in its business are distributed to its shareholders in the form of dividends.
It is in the form of cash and the amount is usually determined after a board meeting.
The dividend yield of Nifty has usually been between 1-2%. It has reached around 3% during 2003 signifying the grossly undervalued nature of the stock market at the time.
Please note = Historically, a higher dividend yield (2 and above) signifies undervaluation and a lower dividend yield (around 1) signifies over-valuation.
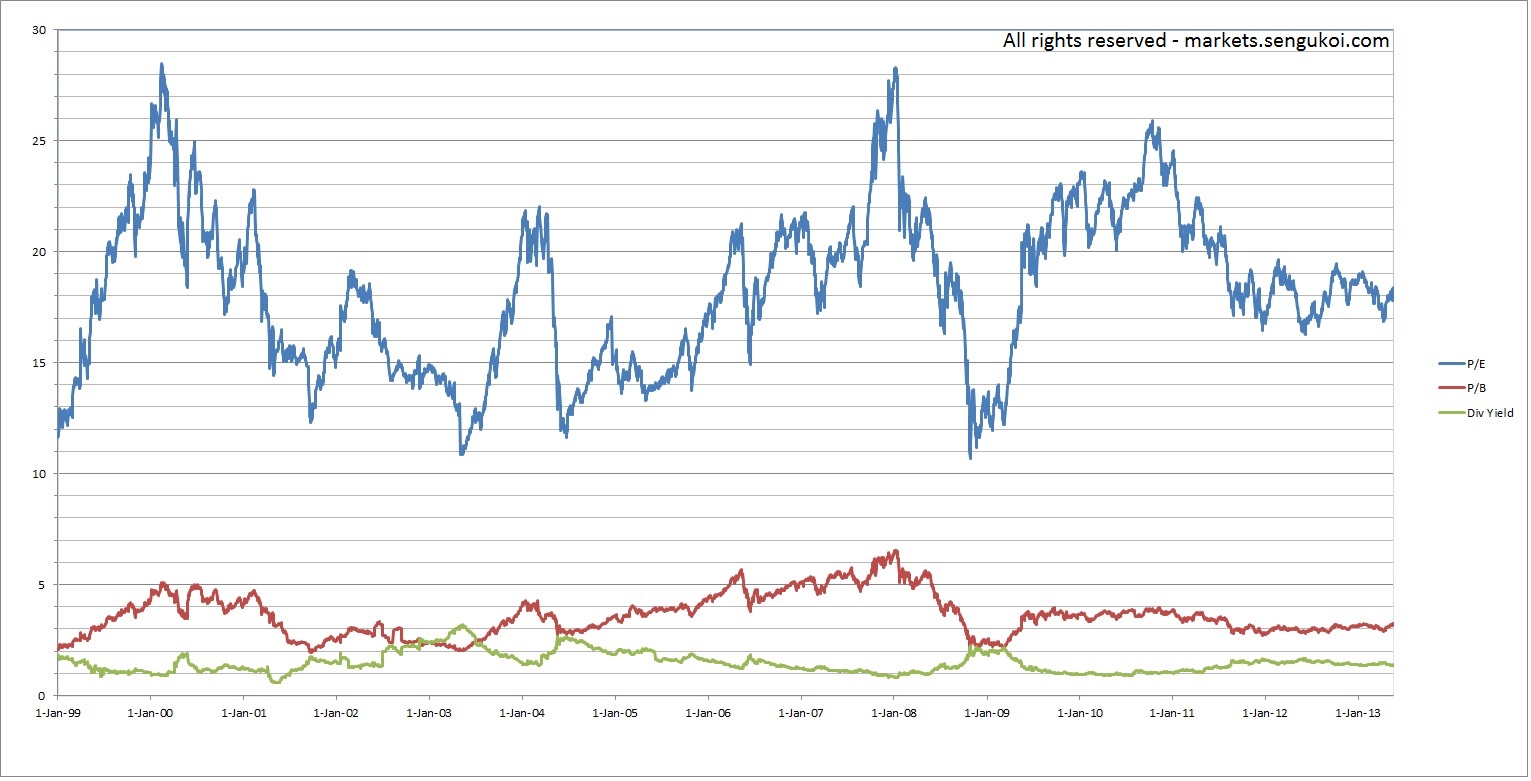
PE ratio, P/B ratio and Dividend yield of the Nifty over the past 14 years.

Now that we know what these terms mean, let’s look at how they were over the past 14 years from January 1999 to May 2013.
Important points to learn from the charts (Analysis)
1) A period of undervaluation (bear markets) is usually followed by a period of overvaluation (bull markets) and vice versa.
For example,
In Jan 1999, the Nifty was grossly undervalued and had not yet crossed the 1992 highs formed during the Harshad Mehta scam for over 7 years. However, soon afterwards, fueled by the global dot-com bubble, it formed a new bull run in the 2000’s.
This was followed by the subsequent dot-com bust in 2001 leading to a prolonged period of undervaluation between 2002-2004.
This period was followed by the next big bull run which spanned 4 years culminating in Jan 2008 when it reached grossly overvalued proportions. This was followed by the simultaneous occurrence of the global financial meltdown, sub-prime mortgage crisis in the US and the Euro Zone debt crisis causing the Nifty to crash in 2009.
Currently the Nifty has been consolidating since 2009 and has yet to cross the 2008 highs. However, as I write, the Nifty is just 3% away from its all-time high of around 6357.
2) The dividend yield and P/B divergence-crossover
If one looks at the above posted chart, they can see some interesting patterns. The dividend yield and P/B lines in the bottom of the chart seem to converge during periods of undervaluation and diverge to form a sort of bulge during periods of overvaluation.
One can see them converging during 1999, 2002-2004, and 2009 (which were basically periods of bear markets where the index was grossly undervalued). One can also see them diverging between 2000, 2008 and 2011 where the index had bull runs and hence was trading at rich valuations.
Summary
Its best to be patient in the stock market. Smart people invest when no one is interested in the stock market right at the depths of a bear market and exit when there is a massive euphoria when the pan-wala, barber and everyone on the road talks and gives tips about the stock market.
As Bernard Baruch said in 1929, “Sell it all! When shoe shine boys are giving out stock tips, it’s time to get out!”
If you liked the article, please share it. If you have anything to say or ask, feel free to leave a comment in the comments section below.
Like our facebook page @ http://www.facebook.com/markets.sengukoi
Image credit – kanjiroushi
Latest posts by Sengukoi (see all)
- MSCI Emerging Markets Index correlation with CNX Nifty - October 5, 2013
- How are options priced? - September 29, 2013
- Sensex chart since 1979 - September 24, 2013
Your blog gives a very useful and it contains very good information. Please update us with more information.
Very good discussion. Please update current data. I mean upto august 2013.